Data visualization transforms raw data into visual formats, making it easier to understand and interpret. Its value is immense. Think of it as turning data into a story that everyone can follow and act upon.
Where does it add value:
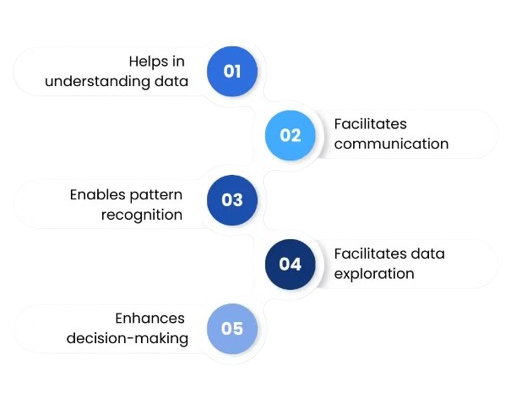
Clarity: : Simplifies complex data, making it accessible at a glance.
Insight: Helps uncover patterns and trends not immediately obvious in raw data.
Communication: Facilitates sharing findings, making discussions datadriven and clearer.
Engagement: Engages the audience more effectively than raw data or text.
Decision-Making: Supports quick, informed decisions with clear visual insights.
Anomaly Detection: Easily spot outliers or anomalies that could indicate issues or opportunities.
AI driven dataVisualization
AI-driven data visualization leverages advanced algorithms to transform raw data into insightful, visually appealing formats. AI-driven data visualization turns complex data into clear, actionable stories, making it easier for businesses to derive meaningful insights and make data-driven decisions.
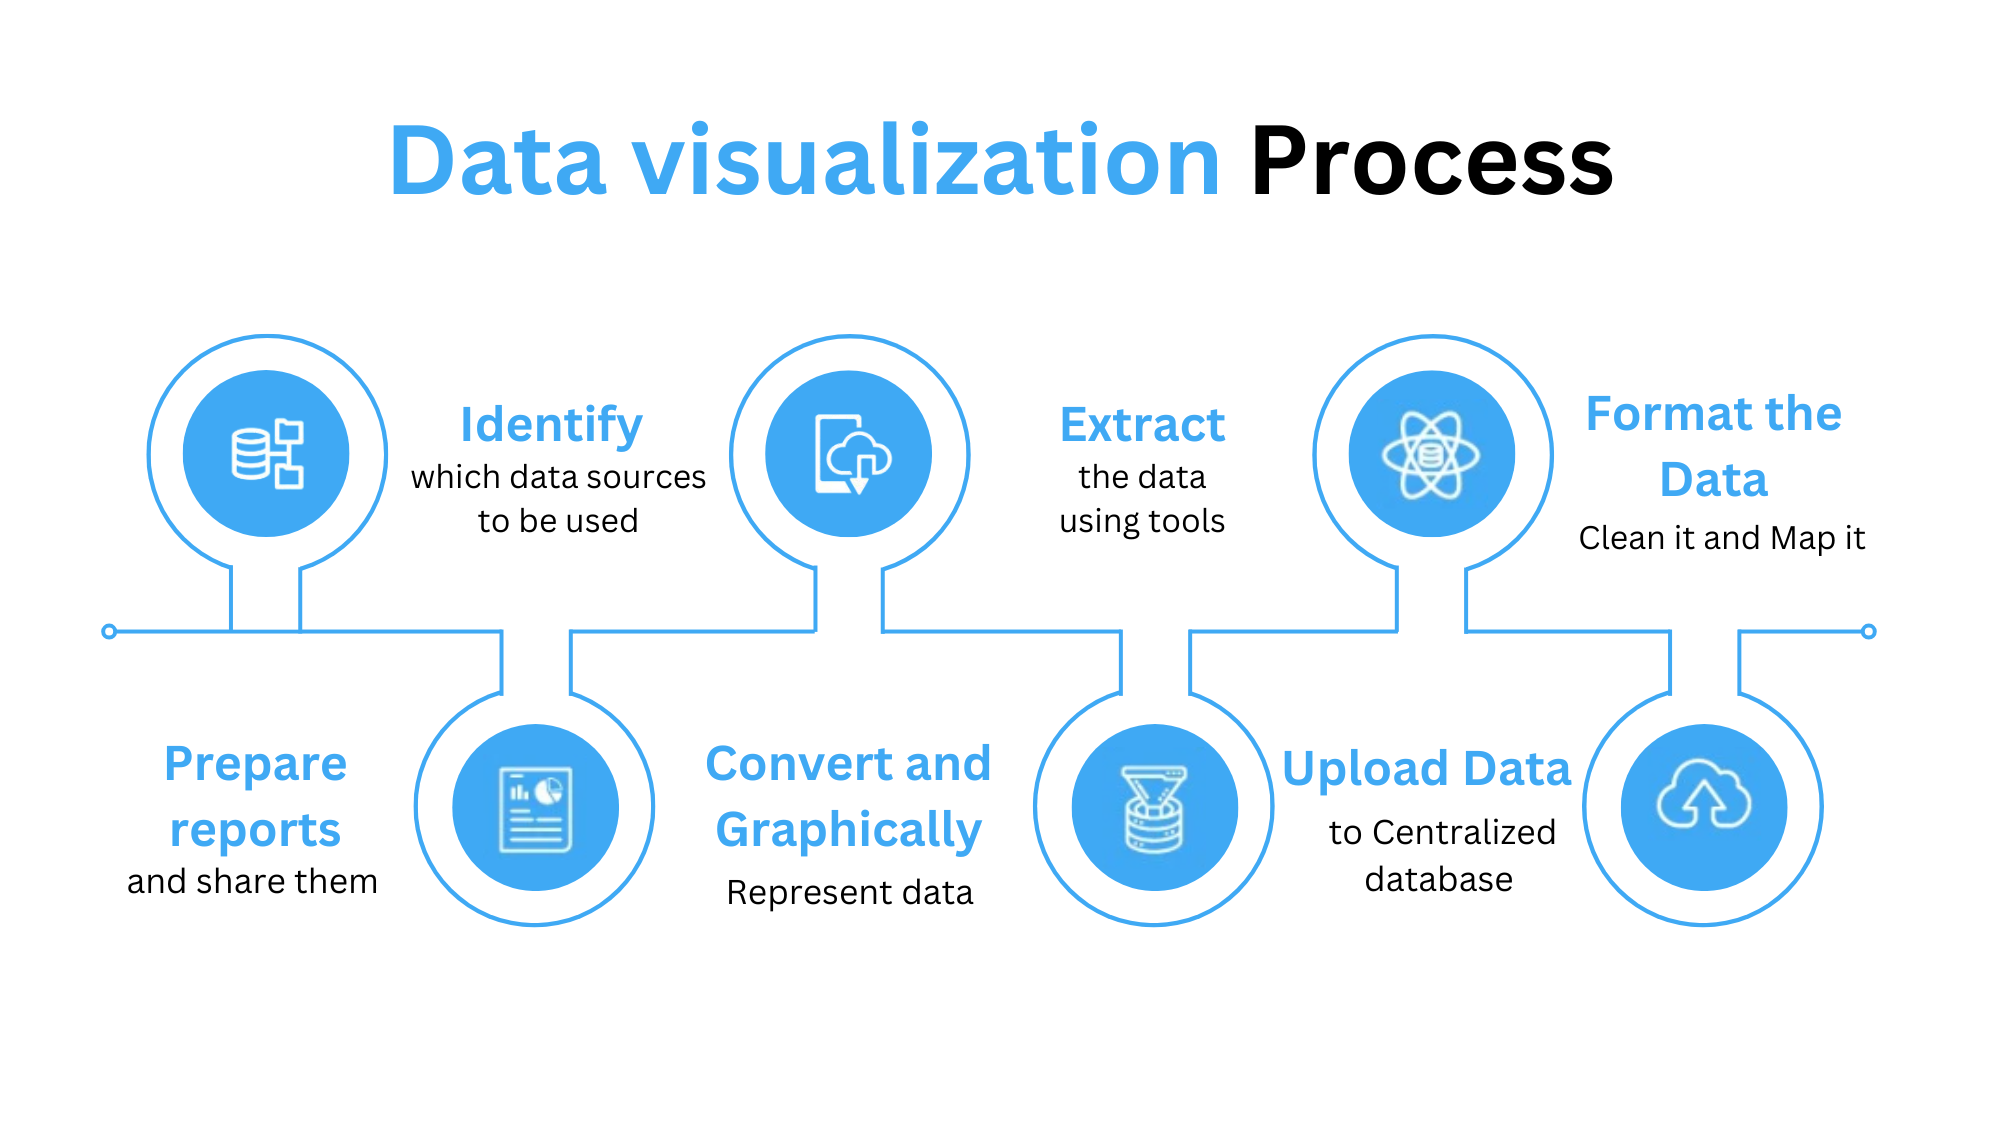
How we do:
Data Collection and Preparation
The first step involves gathering data from various sources and cleaning it to ensure accuracy. AI can automate data cleaning processes, identifying and correcting errors to ensure high-quality data.
Feature Engineering
AI helps identify the most relevant data attributes (features) to visualize. It can automatically extract and select features that are most significant for the analysis.
Selection of Visualization Techniques
AI algorithms can analyze the data to determine the best visualization techniques (e.g., bar charts, line graphs, heat maps) based on the data characteristics and the insights sought.
Automated Visualization Creation
AI can automate the creation of visualizations by interpreting the data and choosing appropriate layouts, colors, and styles. This step often involves tools like AutoML (Automated Machine Learning) that can generate visual insights.
Interactive Dashboards
AI can enhance dashboards with interactive features, allowing users to drill down into data, filter results, and explore different perspectives. Tools like Tableau, Power BI, and Google Data Studio use AI to create these dynamic interfaces.
Natural Language Processing (NLP)
NLP allows AI to understand and generate human language, making data visualization more accessible. Users can ask questions in natural language, and AI can generate visual responses, making the interaction intuitive and user-friendly.
Anomaly Detection and Insights Generation
AI can automatically detect anomalies and generate insights, highlighting significant patterns, trends, and outliers. This helps users quickly identify important information without manually sifting through data.
Continuous Learning
AI systems can continuously learn and improve from new data. As more data is processed, the AI can refine its visualizations, making them more accurate and relevant over time.
Personalized Visualizations
AI can tailor visualizations to individual user preferences and needs, providing personalized insights. This customization enhances the relevance and impact of the visual data.
Benefits of AI
Efficiency: Automates timeconsuming tasks, freeing up human resources for more strategic activities
Accuracy: Reduces errors in data preparation and visualization.
Scalability: Easily handles large and complex datasets
Accessibility: Makes data insights more accessible to nonexperts through natural language queries and interactive dashboards.